Chapter 2 Data sources
2.1 311 Service Request Data
The 311 service request data from 2018 to 2021 is downloaded from City of Boston ’s open data hub. The datasets includes all channels of engagement in which a service request is crated from year 2018 - 2021. In total, there are 1,047,926 cases. Below is the table of variables in this data set.
| Feature | Description |
|---|---|
| case_enquiry_id | The unique ID of each case |
| open_dt | Open time of the case |
| target_dt | Target time of the case |
| closed_dt | Closed time of the case |
| ontime | Whether the case is ontime or overdue |
| case_status | Status of the case (‘Closed’, ‘Open’) |
| closure_reason | Closure status and text indicating findings or work done to close a given case. |
| case_title | Title given to a case. |
| subject | Part of a case classification hierarchy (subject > reason > type) |
| reason | Part of a case classification hierarchy (subject > reason > type) |
| type | Part of a case classification hierarchy (subject > reason > type) |
| queue | Queue a case is assigned to |
| department | Department a case is assigned to |
| submittedphoto | Photo submitted by the citizen along with the request |
| closedphoto | Closed photo of the case |
| location | Detailed location of the case |
| fire_district | BFD fire district case falls within |
| pwd_district | Public Works district a case falls within |
| city_council_district | City Council district a case falls within |
| police_district | Police district a case falls within |
| neighborhood | Neighborhood relayed by caller and entered by call taker |
| neighborhood_services_district | Districts under the Office of Neighborhood Services |
| ward | Election ward a case falls within |
| precinct | Election precinct a case falls within |
| location_street_name | Street name a case falls within |
| location_zipcode | Zip code a case falls within |
| latitude | Latitude of a case |
| longitude | Longitude of a case |
| source | Channel that citizens use to make the request (‘Constituent Call’, ‘Citizens Connect App’, ‘City Worker App’,‘Self Service’, ‘Employee Generated’, ‘Twitter’,‘Maximo Integration’) |
| year | Year of the case |
2.1.1 Response Metrics
There are four response metrics in this study:
Close Rate: Number of close cases divided by total number of requests. The close cases are identified from ‘case status’.
Resolved Rate: Number of resolved cases divided by total number of requests. The resolved cases are identified from ‘closure_reason’.
Awaiting Time: Time period between open time and closed time of a request which is ‘closed_dt’ - ‘open_dt’.
Number of Requests Per Capita: Total number of requests in a neighborhood accumulated by four years divided by the population of that neighborhood. Population data will be described below.
2.2 Demographic Data
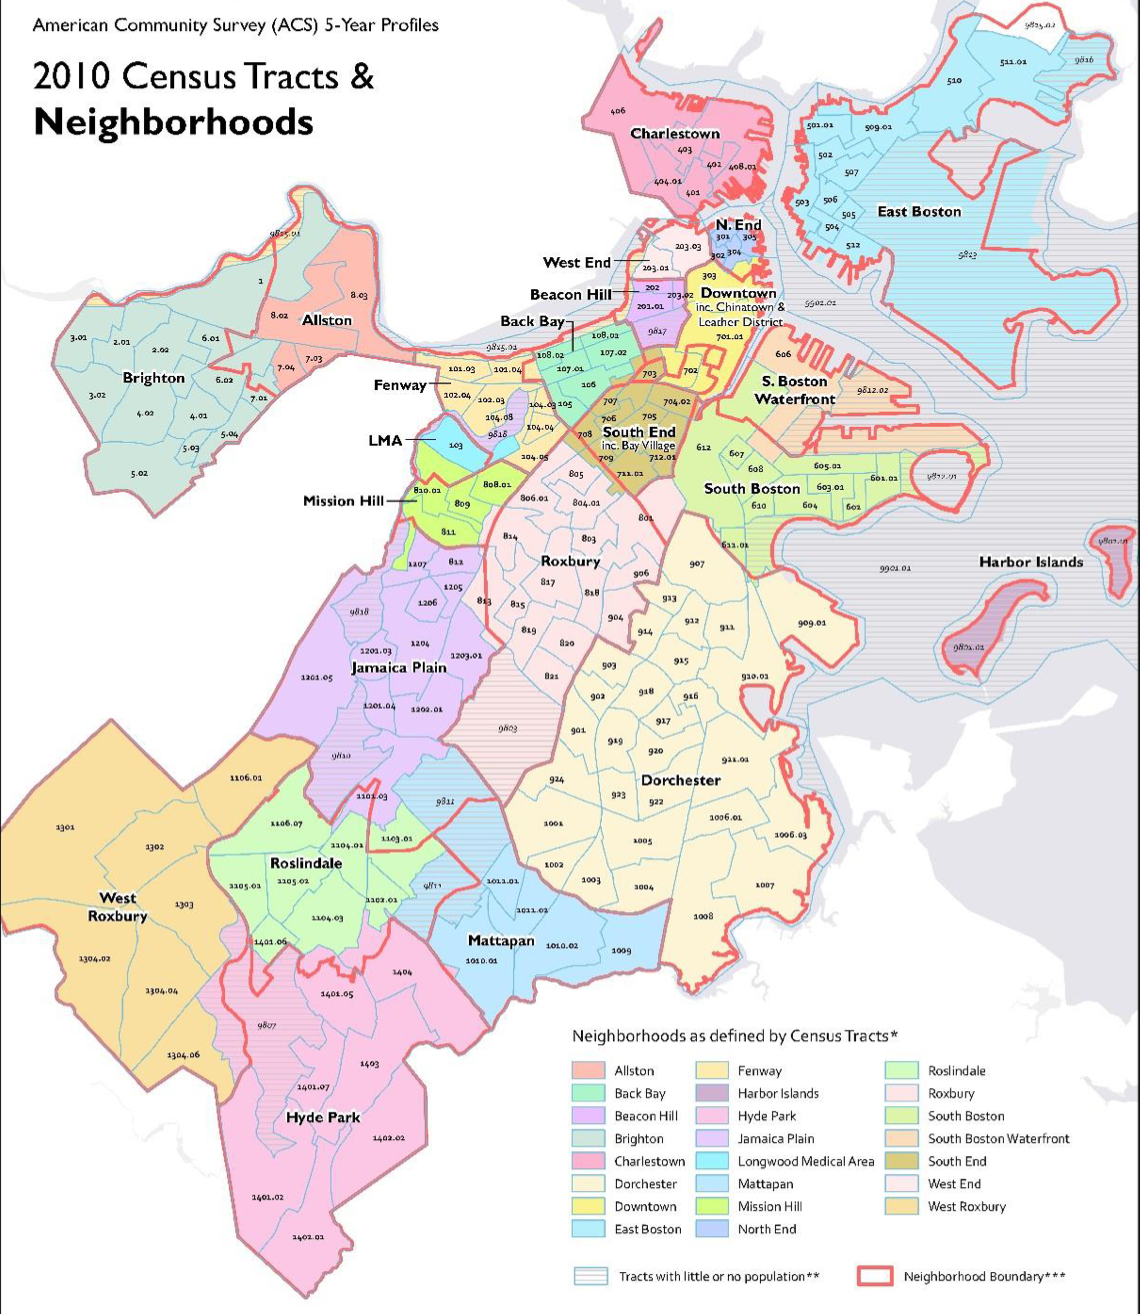
Demographic related data grouped by neighborhoods, including race, per capita income, education level, poverty rate, is also downloaded from City of Boston ’s open data hub compiled by Boston Planning and Development Agency (BPDA). Since cencus data is not collected in every year, 2015-2019 dataset is the most recent available 5-year American Community Survey (ACS) neighborhood demographic data. The demographic data is joined with 311 requests dataset by neighborhood.